Log Custom Metrics from ELT Pipelines to Application Insights
Handling Observability in pipelines during Data ingestion and Transformation
Performing ETL or ELT on data involves ingesting raw data from upstream systems, cleansing and transforming them through different stages before storing them in a data sink. Data Scientists use this data for their machine learning models and expect to have data with a predictable data model, i.e. a fixed schema, with no rows that contain null values in columns or have values that go beyond allowed boundary values etc. In the process, it is possible that certain rows would be discarded and it is required to capture the row counts of data that is discarded and an alert sent to the stakeholders with information that would be helpful to fix those issues in the upstream systems. This article focusses on implementing observability in the solution to cater to this requirement. Azure Databricks Notebooks are used to author the ELT Pipelines and Azure Data Lake Store Gen2 is used as the data store.
Scenario Description
In the scenario considered here, raw data for different datasets is pushed to a raw data landing store in Azure Data Lake Store Gen2 (ADLS Gen2) in the form of compressed tar archives that contain data in formats like CSV, ORC, etc. Data is received once everyday in the form of batch files that contains net new data for some datasets and a consolidated set of data for others.
- Autoloader in Azure Databricks is used to pick up new files deposited in the “raw” landing zone, extract the data in the raw form within and store them in ADLS Gen2 to locations earmarked for ‘bronze’ datasets.
- The next step in the ELT pipeline reads the data in the bronze datasets, performs schema validation and merge, before storing the data back into ADLS Gen2 in a location designated as ‘silver’ datasets. No rows are discarded in this process.
- The next step in the ELT Pipeline involves performing validation on the data, like changing data types and formats to an agreed target schema, ensuring there are no rows with null value columns etc, before storing the data back into ADLS Gen2 into a designated location earmarked for ‘Gold’ datasets. In the process, certain rows could be discarded on account of the validation performed.
The sections below focus on implementing a solution that would:
- detect when rows are dropped during the ELT pipeline execution
- raise an alert to notify the stakeholders with contextual information
Emitting Metrics from ELT Pipelines
Retrieve ELT operation metrics
Within the ELT pipelines, we can capture metrics of write operations on Delta table such as insert, update, merge etc. We can retrieve information about each write operation to a Delta table by running the history command. The operations are returned in reverse chronological order, where running history(1) returns the last operation to the Delta table. The history operation returns a collection of operations metrics in the operationMetrics column. The operation metrics can vary for different write operations.
| Operation | Metric name | Description |
|---|---|---|
| Insert | numFiles | Number of files written. |
| numOutputBytes | Size in bytes of the written contents. | |
| numOutputRows | Number of rows written. | |
| Update | numAddedFiles | Number of files added. |
| numRemovedFiles | Number of files removed. | |
| numUpdatedRows | Number of rows updated. | |
| numCopiedRows | Number of rows just copied over in the process of updating files. | |
| Merge | numSourceRows | Number of rows in the source DataFrame. |
| numTargetRowsInserted | Number of rows inserted into the target table. | |
| numTargetRowsUpdated | Number of rows updated in the target table. | |
| numTargetRowsDeleted | Number of rows deleted in the target table. | |
| numTargetRowsCopied | Number of target rows copied. | |
| numOutputRows | Total number of rows written out. | |
| numTargetFilesAdded | Number of files added to the sink(target). | |
| numTargetFilesRemoved | Number of files removed from the sink(target). |
from delta.tables import DeltaTable

deltaTable = DeltaTable.forPath(spark, pathToTable)
lastOperationDF = deltaTable.history(1)
write_metrics = lastOperationDF.collect()[0]["operationMetrics"]
Log custom metrics
OpenCensus is used to collect application metrics and distributed traces, then transfer the data to Azure Monitor in real time. The Azure Monitor Log Handler AzureLogHandler allows you to export Python logs to Azure Monitor.
Prerequisites
-
Azure Monitor exporter can be installed as follows:
pip install opencensus-ext-azure -
Create an Azure Monitor resource and get the Instrumentation Key for Application Insights. The Instrumentation Key can be specified in an environment variable as
APPLICATIONINSIGHTS_CONNECTION_STRING.
Custom properties such as the write metrics derived during ELT operations can be added to log messages in the extra keyword argument using the custom_dimensions field. The custom_dimensions field accepts only a dictionary as an argument. If you pass arguments of any other type, the logger will ignore them.
import logging
from opencensus.ext.azure.log_exporter import AzureLogHandler

logger = logging.getLogger(__name__)
logger.addHandler(AzureLogHandler(connection_string='InstrumentationKey=APPLICATIONINSIGHTS_CONNECTION_STRING'))

logger.info(
    "Metrics for write into delta",
    extra={
        "custom_dimensions": {
            "numSourceRows": write_metrics["numSourceRows"],
            "numTargetRowsInserted": write_metrics["numTargetRowsInserted"],
            "numTargetRowsUpdated": write_metrics["numTargetRowsUpdated"],
        }
    },
)
Detection of data dropped during pipeline execution
During the execution of the pipelines to transform the data from Silver to Gold datasets, certain rows that do not fulfil the validation criteria are discarded. The pipeline logic emits a Log Trace to Azure Application Insights with information like total number of rows written, the timestamp of the pipeline execution run, the name of the dataset assciated with the pipeline, among others.
The pipeline by itself does not keep track of the rows dropped from the dataset. In order to determine this number, the total row count for the dataset written to the Gold datastore is subtracted from the row count written to the Silver datastore, for each dataset. It is to be noted that when writing the datasets from Bronze to Silver datastore, none of the rows are dropped, hence providing a reference point to compare against with the row count written to the Gold datastore.
Design Assumptions
Per dataset, the ELT pipelines that transform data from Bronze to Silver, and the one from Silver to Gold, will be run only once per day. The date of execution of the pipeline is used in the join condition that matches the Silver>Gold with the corresponding Bronze>Silver run for each dataset to determine how many rows were written. If there are multiple runs done per day, then the Application Insights query would return multiple rows and the user would have to manually identify the right one from the results. The Azure Application Insights resource is based on the workspace based SKU (as opposed to the classic SKU), which uses an Azure Log Analytics workspace. Both the App Insights resource and Log Analytics workspace should pre-exist in Azure when running this ARM Template. Some of the features required in the solution, like parameterised queries in Application Insights can only be deployed using ARM Templates, at the time of this writing. Hence, for consistency and ease of deployment, ARM Template based approach is used for the other components as well, e.g. raising Email alerts when there are row deletions detected.
Design approach - Create a Parameterised Function and Saved Query
Azure Application Insights uses Azure Log Analytics workspace to store all the metrics and logs emitted from the Applications. This can be queried using Kusto.
-
A parameterised function, with name/alias ‘elt_dropped_rows_by_pipeline’ is created in the Log Analytics wrkspace associated with the Application Insights.
This function takes 3 parameters:
- string: x (this stands for the dataset Name)
- timespan: y (this stands for the number of days ago to execute the query & locate rows dropped. e.g. 1d 0r 1m etc)
- string: z (this stands for the ‘Message’ property in the Log Metric and the only value it takes is ‘Metrics for write into delta’ - this is the value used to distinguish the row count metrics emitted by the Databricks notebook from other metrices and logs that are meant for a different purpose)
The Kusto query implemented in the function ‘elt_dropped_rows_by_pipeline’ is shown below:
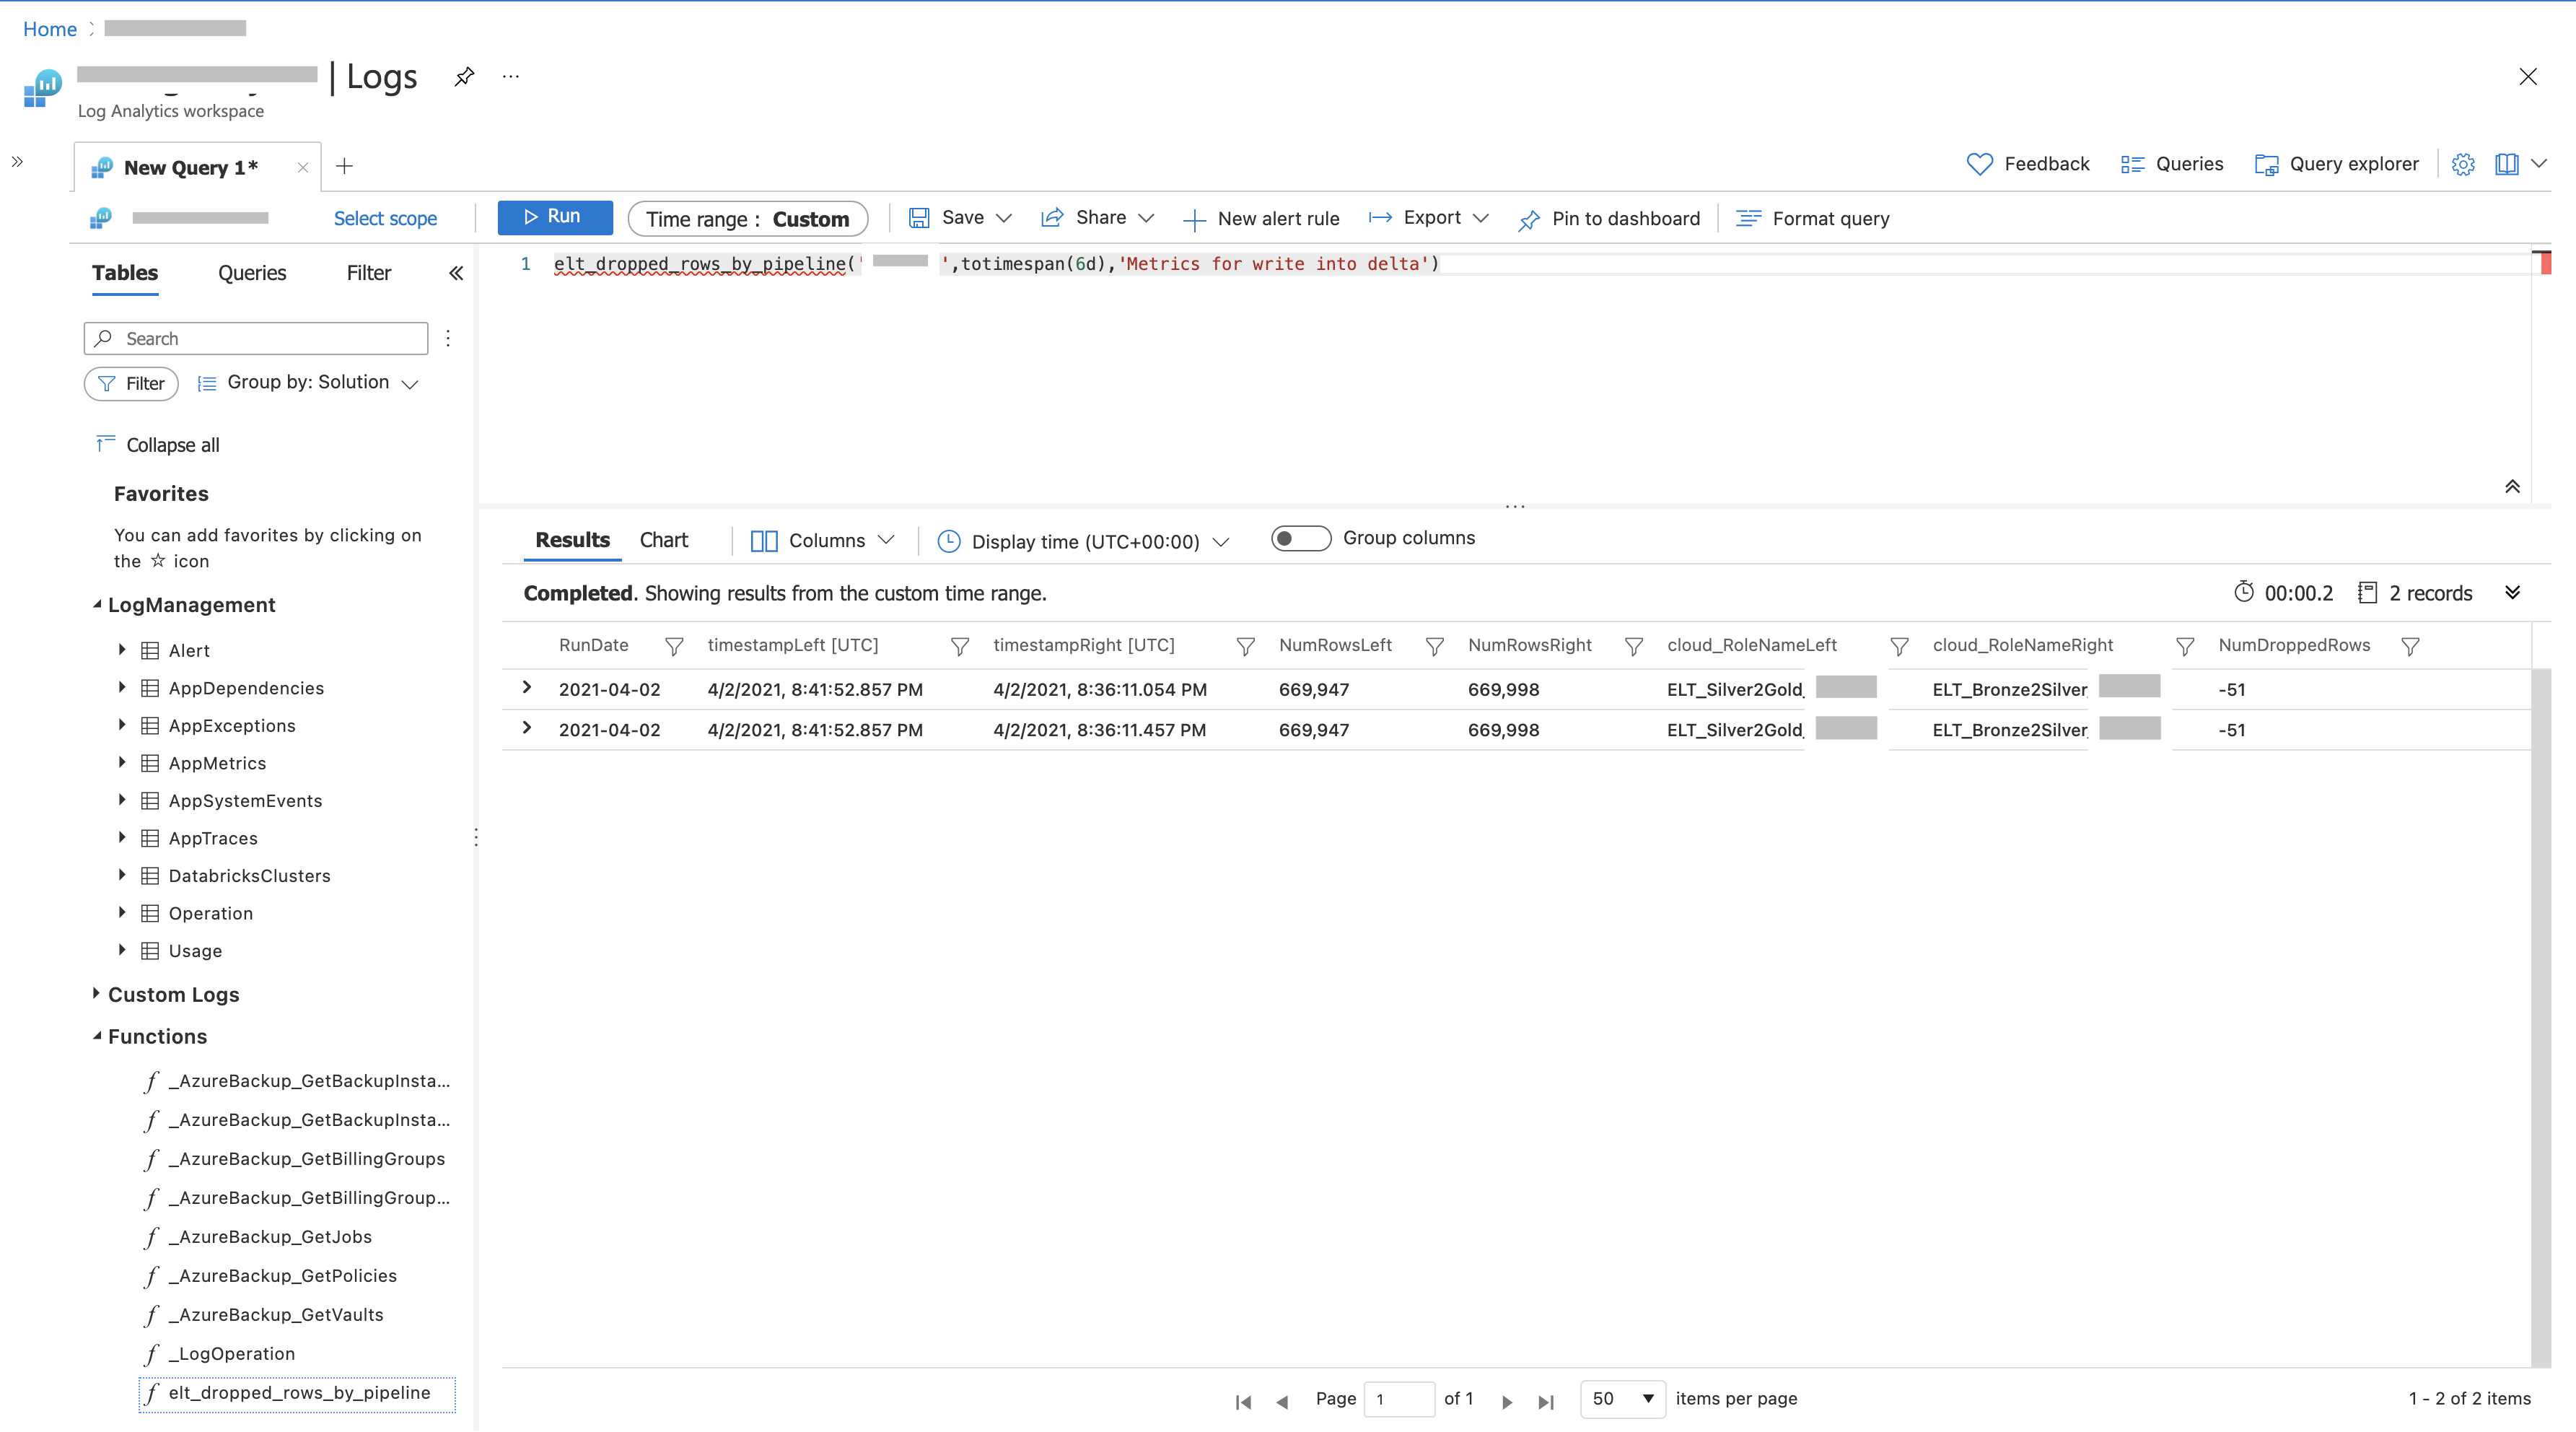
 AppTraces
 | where TimeGenerated > ago(y) and AppRoleName == strcat('ELT_Silver2Gold_', x) and Message == z
 | project timestampLeft=TimeGenerated, RunDate = format_datetime(TimeGenerated, 'yyyy-MM-dd'), NumRowsLeft=todouble(Properties['numOutputRows']), cloud_RoleNameLeft=AppRoleName
 | join (AppTraces
     | where TimeGenerated > ago(y) and AppRoleName == strcat('ELT_Bronze2Silver_', x) and Message == z
     | project timestampRight=TimeGenerated, RunDate = format_datetime(TimeGenerated, 'yyyy-MM-dd'), NumRowsRight=todouble(Properties['numOutputRows']), cloud_RoleNameRight=AppRoleName)
     on $left.RunDate == $right.RunDate
 | project RunDate, timestampLeft, timestampRight, NumRowsLeft, NumRowsRight, cloud_RoleNameLeft, cloud_RoleNameRight, NumDroppedRows = NumRowsLeft - NumRowsRight
The ‘elt_dropped_rows_by_pipeline’ can be seen in the function explorer in the screen shot below. It also shows how this function can be executed. A negative value in the column ‘NumDroppedRows’ indicates that rows were dropped in that dataset.
-
A Saved Search Query by name ‘Query Elt Dropped Rows using function’ is created to test the function above. Saved Queries can be found within the ‘Query Explorer’ > ‘Saved Queries’ in the ‘Log Analytics’ > ‘Logs’ blade on the Azure Portal. Double clicking on it, drops the query syntax to invoke the function and show the results. A sample Kusto query in ‘Saved Queries’, that invokes the function ‘elt_dropped_rows_by_pipeline’ is shown below:
elt_dropped_rows_by_pipeline('Dataset-A',totimespan(10d),'Metrics for write into delta') -
ARM Template - Package & deploy the parameterised function and the ‘Saved search’
The query (function and Saved Search) is packaged using an ARM Template so that it can be deployed to different environments, a sample template shown below.
 {
 "$schema": "https://schema.management.azure.com/schemas/2019-08-01/deploymentTemplate.json#",
 "contentVersion": "1.0.0.0",
 "parameters": {
     "workspaceName": {
     "type": "string",
     "metadata": {
         "description": "Unique name (within the Resource Group) for the existing Log Analytics Workspace Resource"
     }
     }
 },
 "variables": {
     "functionQuery": "AppTraces | where TimeGenerated >  ago(y) and AppRoleName == strcat('ELT_Silver2Gold_', x) and Message == z | project timestampLeft=TimeGenerated, RunDate = format_datetime(TimeGenerated, 'yyyy-MM-dd'), NumRowsLeft=todouble(Properties['numOutputRows']), cloud_RoleNameLeft=AppRoleName | join (AppTraces  | where TimeGenerated > ago(y) and AppRoleName == strcat('ELT_Bronze2Silver_', x) and Message == z | project timestampRight=TimeGenerated, RunDate = format_datetime(TimeGenerated, 'yyyy-MM-dd'), NumRowsRight=todouble(Properties['numOutputRows']), cloud_RoleNameRight=AppRoleName)  on $left.RunDate == $right.RunDate | project RunDate, timestampLeft, timestampRight, NumRowsLeft, NumRowsRight, cloud_RoleNameLeft, cloud_RoleNameRight, NumDroppedRows = NumRowsLeft - NumRowsRight",
     "functionAlias":"elt_dropped_rows_by_pipeline",
     "functionParameters":"x:string , y:timespan , z:string",
     "functionname":"Parameterized Elt Dropped Rows Query Function",
     "savedSearchName":"Query Elt Dropped Rows using function",
     "savedSearchQuery":"elt_dropped_rows_by_pipeline('Dataset-A',totimespan(1d),'Metrics for write into delta')"
 },
 "resources": [
     {
     "type": "Microsoft.OperationalInsights/workspaces",
     "apiVersion": "2020-08-01",
     "name": "[parameters('workspaceName')]",
     "location": "[resourceGroup().location]",
     "resources": [
         {
         "type": "savedSearches",
         "apiVersion": "2020-08-01",
         "name": "[variables('functionname')]",
         "dependsOn": [
             "[concat('Microsoft.OperationalInsights/workspaces/', parameters('workspaceName'))]"
         ],
         "properties": {
             "etag": "*",
             "displayName": "Get count of rows dropped in ELT Pipeline",
             "category": "Sample Queries",
             "FunctionAlias": "[variables('functionAlias')]",
             "FunctionParameters": "[variables('functionParameters')]",
             "query": "[variables('functionQuery')]"
         }
         },
         {
         "type": "savedSearches",
         "apiVersion": "2020-08-01",
         "name": "[variables('savedSearchName')]",
         "dependsOn": [
             "[concat('Microsoft.OperationalInsights/workspaces/', parameters('workspaceName'))]"
         ],
         "properties": {
             "etag": "*",
             "displayName": "Query Elt Dropped Rows using function",
             "category": "Sample Queries",
             "query": "[variables('savedSearchQuery')]"
         }
         }
     ]
     }
 ]
 }
Design approach - Create a rule to check for dropped rows and raise an Email Alert
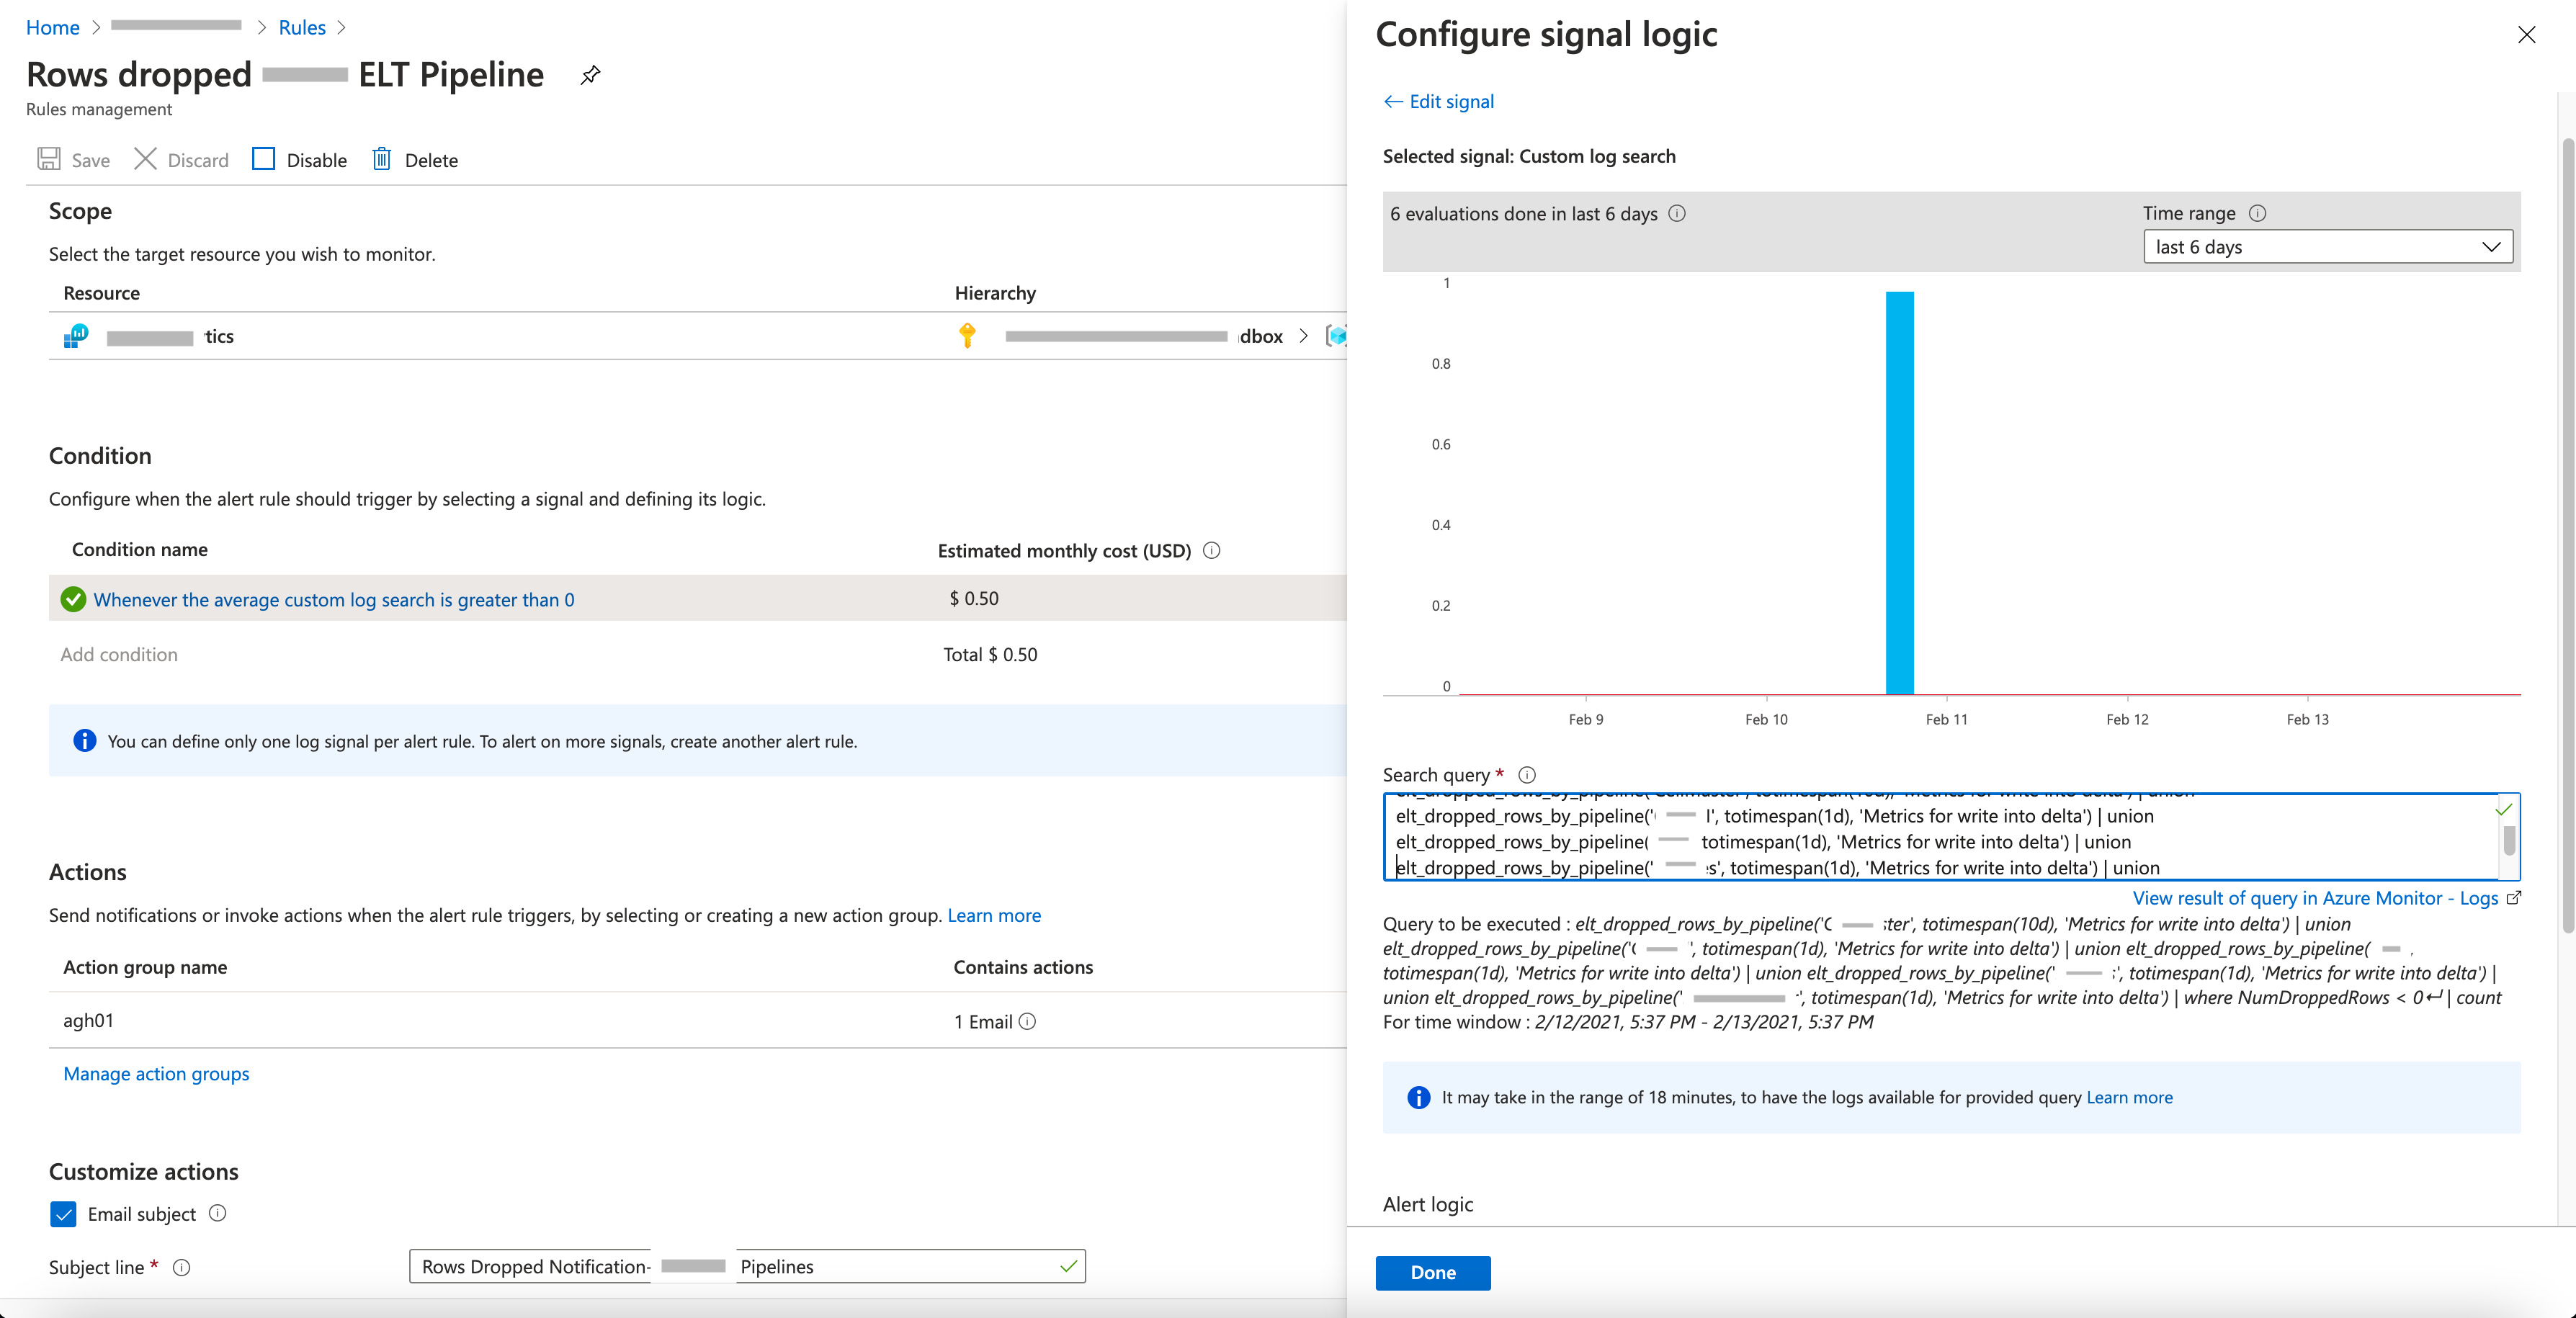
This rule will execute the function ‘Query Elt Dropped Rows using function’ everyday, for all the datasets and check if there are any rows dropped across all datasets and then send an Email Alert if that is the case.
See the Alert rule configured in the screenshot below.
-
Query to detect if the rule condition is met that there are one or more datasets where NumRowsDropped has a value less than 0
 elt_dropped_rows_by_pipeline('dataset-A', totimespan(10d), 'Metrics for write into delta') | union
 elt_dropped_rows_by_pipeline('dataset-B', totimespan(1d), 'Metrics for write into delta') | union
 elt_dropped_rows_by_pipeline('dataset-C', totimespan(1d), 'Metrics for write into delta') | union
 elt_dropped_rows_by_pipeline('dataset-D', totimespan(1d), 'Metrics for write into delta') | union
 elt_dropped_rows_by_pipeline('dataset-E', totimespan(1d), 'Metrics for write into delta') | where
 NumDroppedRows < 0
See the screenshot below for more details about the alert rule condition.
-
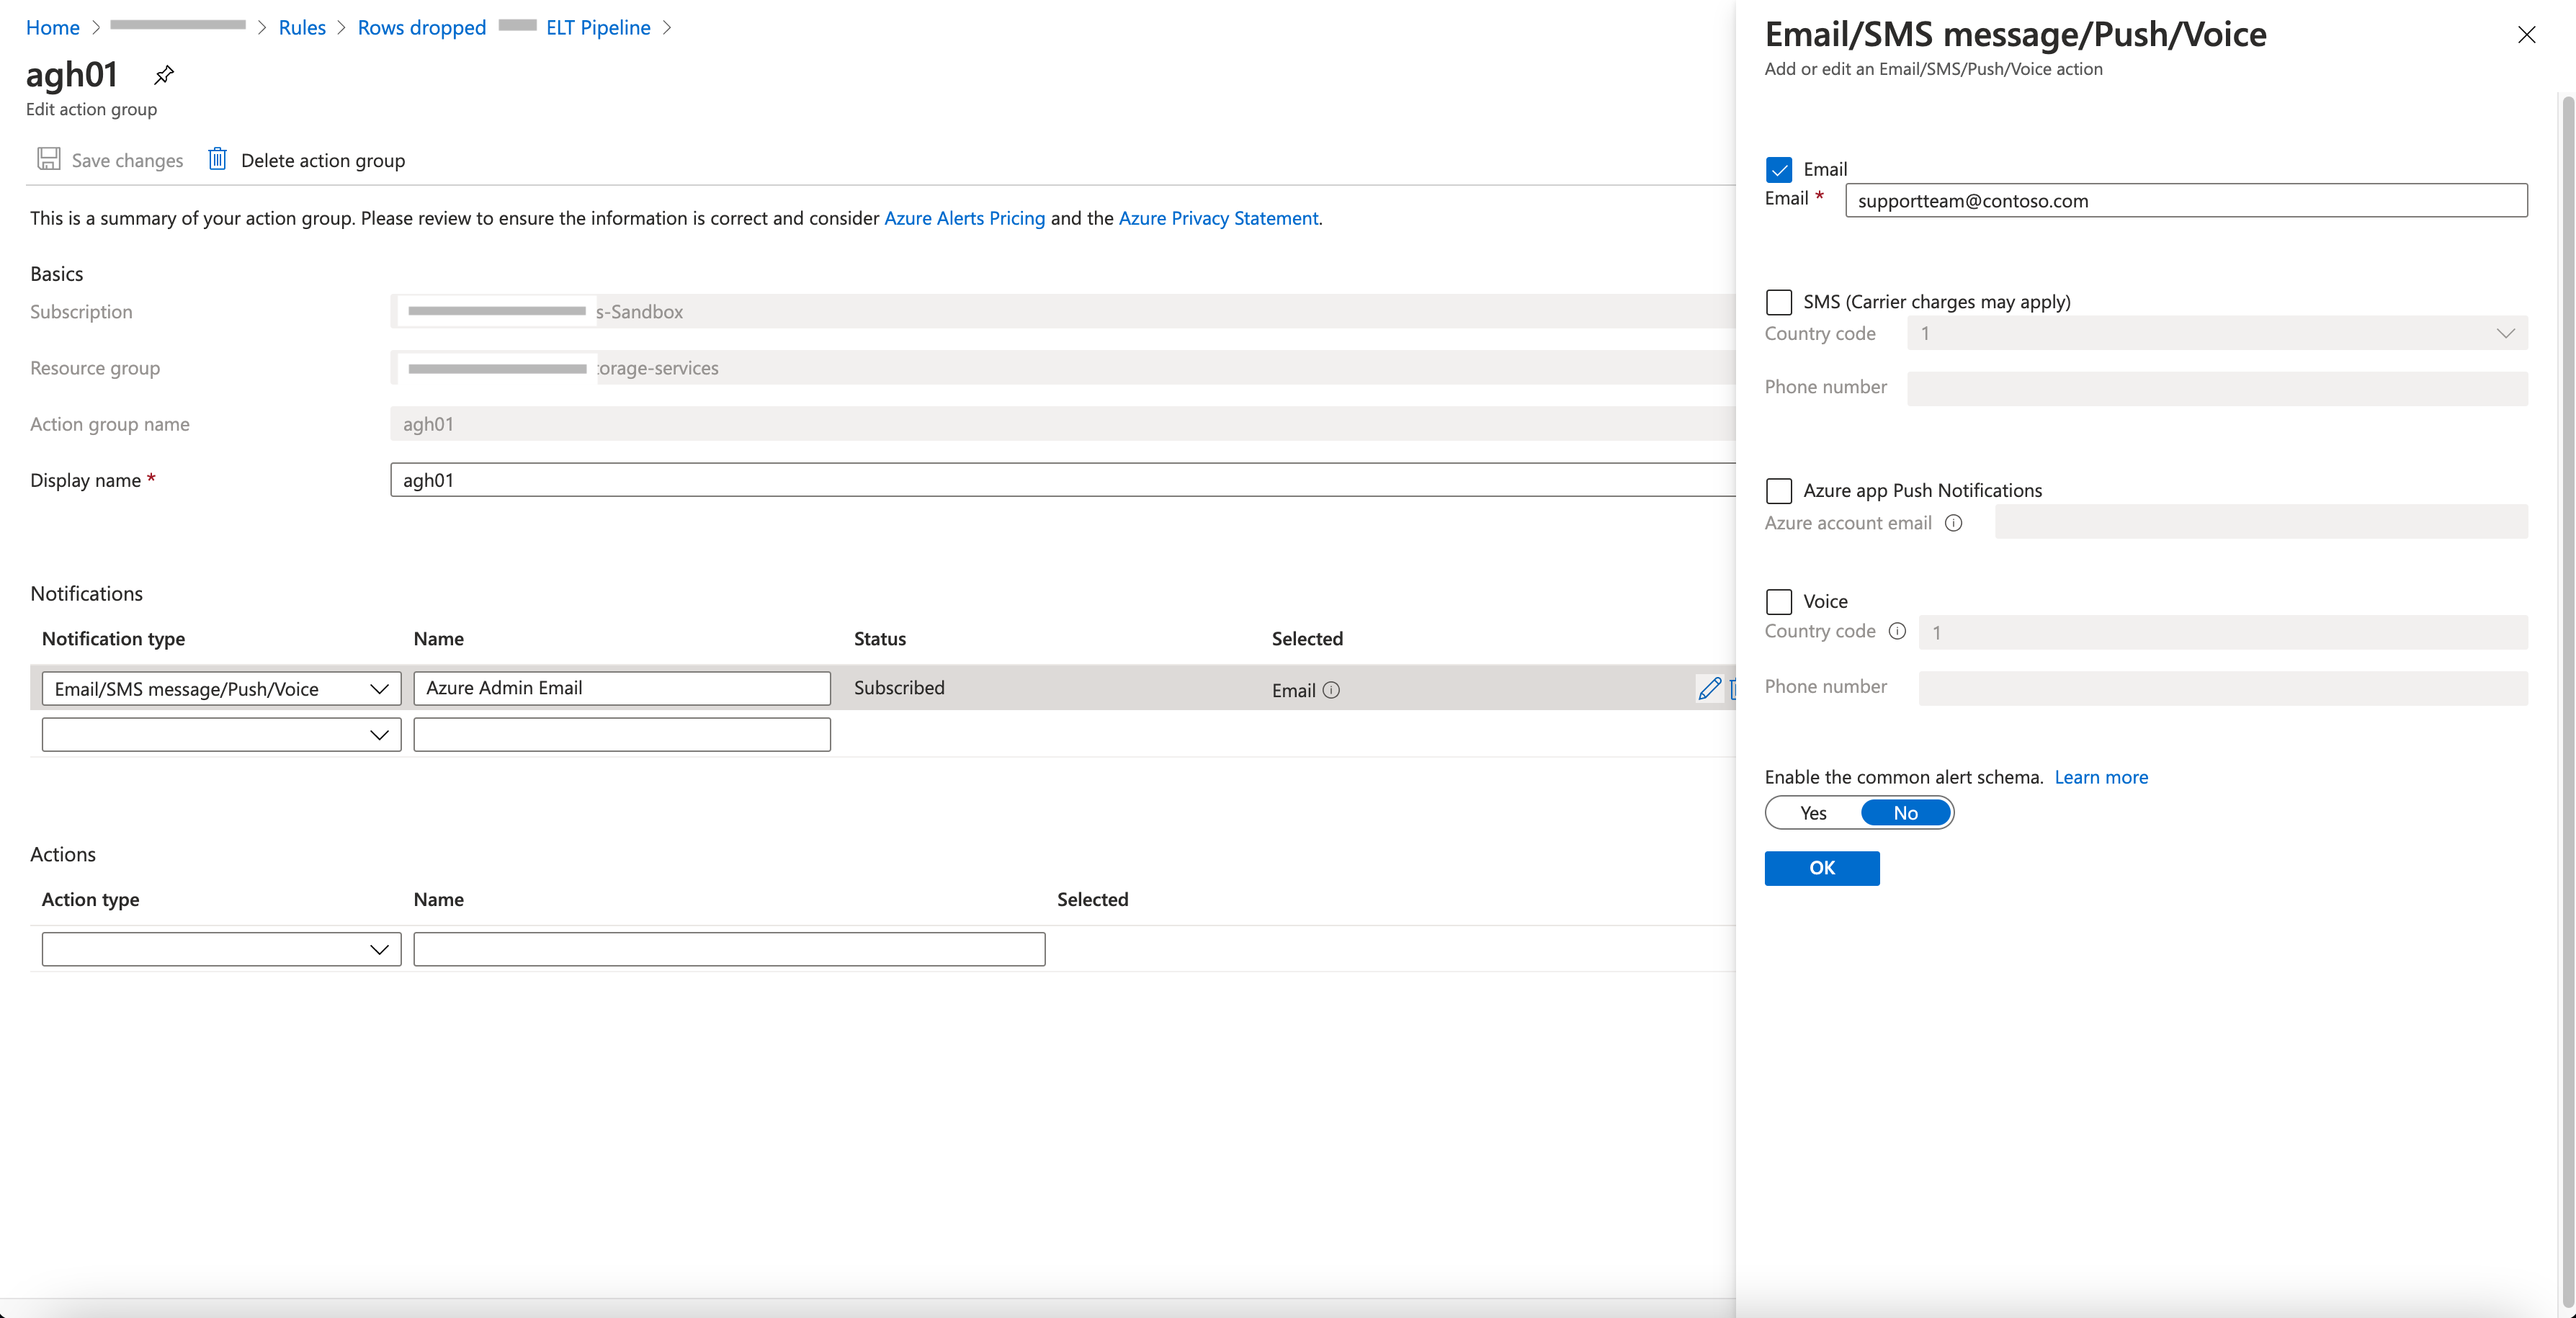
If this rule condition is met, then a Log Analytics Action Group that is associated with this rule, generates an Email Alert. The rule is configured to run once evey day (every 1440 minutes) on a data that spans 1440 minutes.
See how the Action Group is configured, in the screenshot below:
-
ARM Template - Package & Deploy the Alert Rule and Action Group
Sample ARM Template below that configures the action group and alert action in the Log Analytics workspace
 {
     "$schema": "https://schema.management.azure.com/schemas/2019-04-01/deploymentTemplate.json#",
     "contentVersion": "1.0.0.0",
     "parameters": {
         "logAnalyticsWorkspaceName": {
             "type": "string",
             "metadata": {
                 "description": "Unique name (within the Resource Group) for the Log Analytics Workspace."
             }
         },
         "actionGroupName": {
             "type": "string",
             "metadata": {
                 "description": "Unique name (within the Resource Group) for the Action group."
             }
         },
         "actionGroupShortName": {
             "type": "string",
         "metadata": {
                 "description": "Short name (maximum 12 characters) for the Action group."
             }
         },
         "triggerOperator": {
             "allowedValues": [
                 "GreaterThan",
                 "LessThan",
                 "Equal"
             ],
             "defaultValue": "GreaterThan",
             "metadata": {
                 "description": "The comparison operator to use when verifying the condition - the number of rows returned by the Query condition"
             },
             "type": "string"
         },
         "triggerThresholdvalue": {
             "type": "int",
             "defaultValue": 0,
             "metadata": {
                 "description": "The number of rows returned should be compared with this value to determine whether the condition to raise the alert is met or not"
             }
         },
         "alertName": {
             "type": "string",
             "defaultValue": "Rows dropped in ELT Pipeline",
             "metadata": {
                 "description": "The name of the alert to create in the Log Analytics Workspace."
             }
         },
         "alertDescription": {
             "type": "string",
             "defaultValue": "email alert for row drops during elt pipelines",
             "metadata": {
                 "description": "The name of the alert to create in the Log Analytics Workspace."
             }
         },
         "alertFrequency": {
             "type": "int",
             "defaultValue": 1440,
             "metadata": {
                 "description": "The default frequency of 1440 corresponds to once a day"
             }
         },
         "alertTimeSpan": {
             "type": "int",
             "defaultValue": 1440,
             "metadata": {
                 "description": "The default timespan over which to run this query - 1440 - corresponds to a day"
             }
         },
         "actionEmailSubject": {
             "type": "string",
             "defaultValue": "Rows Dropped Notification- Sample ELT Pipelines",
             "metadata": {
                 "description": "The subject in the email alert"
             }
         },
         "actionEmailRecipient": {
             "type": "string",
             "defaultValue": "supportteam@contoso.com",
             "metadata": {
                 "description": "The email Address of the recipient"
             }
         },
         "actionDescription": {
             "type": "string",
             "defaultValue": "Row Dropped Email Notification- Sample ELT Pipelines",
             "metadata": {
                 "description": "The subject in the email alert"
             }
         }
     },
     "variables": {
         "alertLocation": "[resourceGroup().location]",
         "alertName": "[parameters('alertName')]",
         "alertDescription": "[parameters('alertDescription')]",
         "alertStatus": "true",
         "alertSource": {
             "Query": "elt_dropped_rows_by_pipeline('Dataset-A', totimespan(1d), 'Metrics for write into delta') | union elt_dropped_rows_by_pipeline('Dataset-B', totimespan(1d), 'Metrics for write into delta') | union elt_dropped_rows_by_pipeline('Dataset-C', totimespan(1d), 'Metrics for write into delta') | union elt_dropped_rows_by_pipeline('Dataset-D', totimespan(1d), 'Metrics for write into delta') | union elt_dropped_rows_by_pipeline('Dataset-E', totimespan(1d), 'Metrics for write into delta') | where NumDroppedRows < 0",
             "SourceId": "[resourceId('Microsoft.OperationalInsights/workspaces',parameters('logAnalyticsWorkspaceName'))]",
             "Type": "ResultCount"
         },
         "alertSchedule": {
             "Frequency": "[parameters('alertFrequency')]",
             "Time": "[parameters('alertTimeSpan')]"
         },
         "alertActions": {
             "SeverityLevel": "4"
         },
         "alertTrigger": {
             "Operator": "[parameters('triggerOperator')]",
             "Threshold": "[parameters('triggerThresholdvalue')]"
         },
         "actionGrp": {
             "ActionGroup": "[resourceId('Microsoft.Insights/actionGroups',parameters('actionGroupName'))]",
             "Subject": "[parameters('actionEmailSubject')]",
             "Description": "[parameters('actionDescription')]",
             "Webhook": "{ \"alertname\":\"#alertrulename\", \"IncludeSearchResults\":true }"
         }
     },
     "resources": [
         {
             "name": "[variables('alertName')]",
             "type": "Microsoft.Insights/scheduledQueryRules",
             "apiVersion": "2018-04-16",
             "location": "[variables('alertLocation')]",
             "dependsOn": [
                 "[resourceId('Microsoft.Insights/actionGroups',parameters('actionGroupName'))]"
             ],
             "properties": {
                 "description": "[variables('alertDescription')]",
                 "enabled": "[variables('alertStatus')]",
                 "source": {
                     "query": "[variables('alertSource').Query]",
                     "dataSourceId": "[variables('alertSource').SourceId]",
                     "queryType": "[variables('alertSource').Type]"
                 },
                 "schedule": {
                     "frequencyInMinutes": "[variables('alertSchedule').Frequency]",
                     "timeWindowInMinutes": "[variables('alertSchedule').Time]"
                 },
                 "action": {
                     "odata.type": "Microsoft.WindowsAzure.Management.Monitoring.Alerts.Models.Microsoft.AppInsights.Nexus.DataContracts.Resources.ScheduledQueryRules.AlertingAction",
                     "severity": "[variables('alertActions').SeverityLevel]",
                     "aznsAction": {
                         "actionGroup": "[array(variables('actionGrp').ActionGroup)]",
                         "emailSubject": "[variables('actionGrp').Subject]",
                         "customWebhookPayload": "[variables('actionGrp').Webhook]"
                     },
                     "trigger": {
                         "thresholdOperator": "[variables('alertTrigger').Operator]",
                         "threshold": "[variables('alertTrigger').Threshold]"
                     }
                 }
             }
         },
         {
             "type": "Microsoft.Insights/actionGroups",
             "apiVersion": "2018-03-01",
             "name": "[parameters('actionGroupName')]",
             "location": "Global",
             "properties": {
                 "groupShortName": "[parameters('actionGroupShortName')]",
                 "enabled": true,
                 "emailReceivers": [
                     {
                         "name": "Azure Admin Email",
                         "emailAddress": "[parameters('actionEmailRecipient')]"
                     }
                 ]
             }
         }
     ]
 }
Contributors to the article
This article is co-authored by: